Real-Time Conveyor Dashboards: Which Metrics Deliver the Most Value?

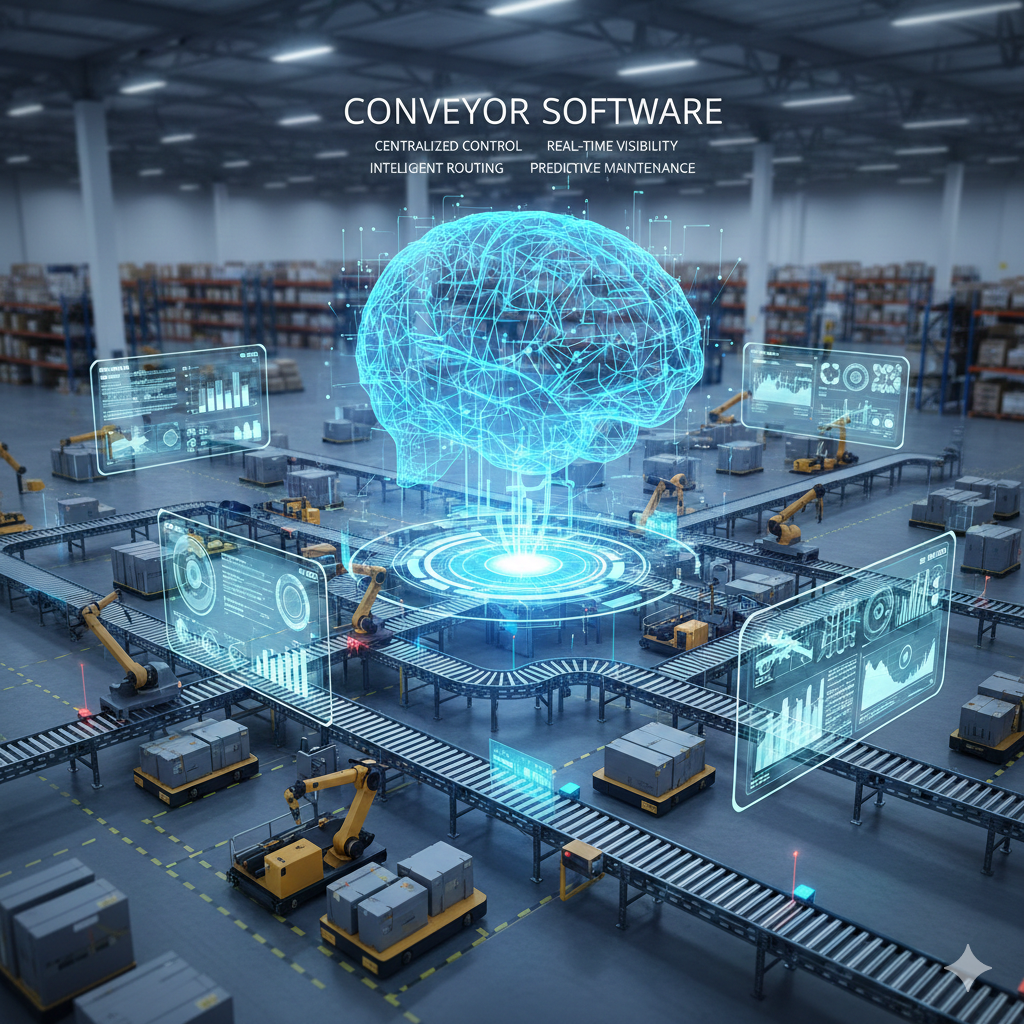
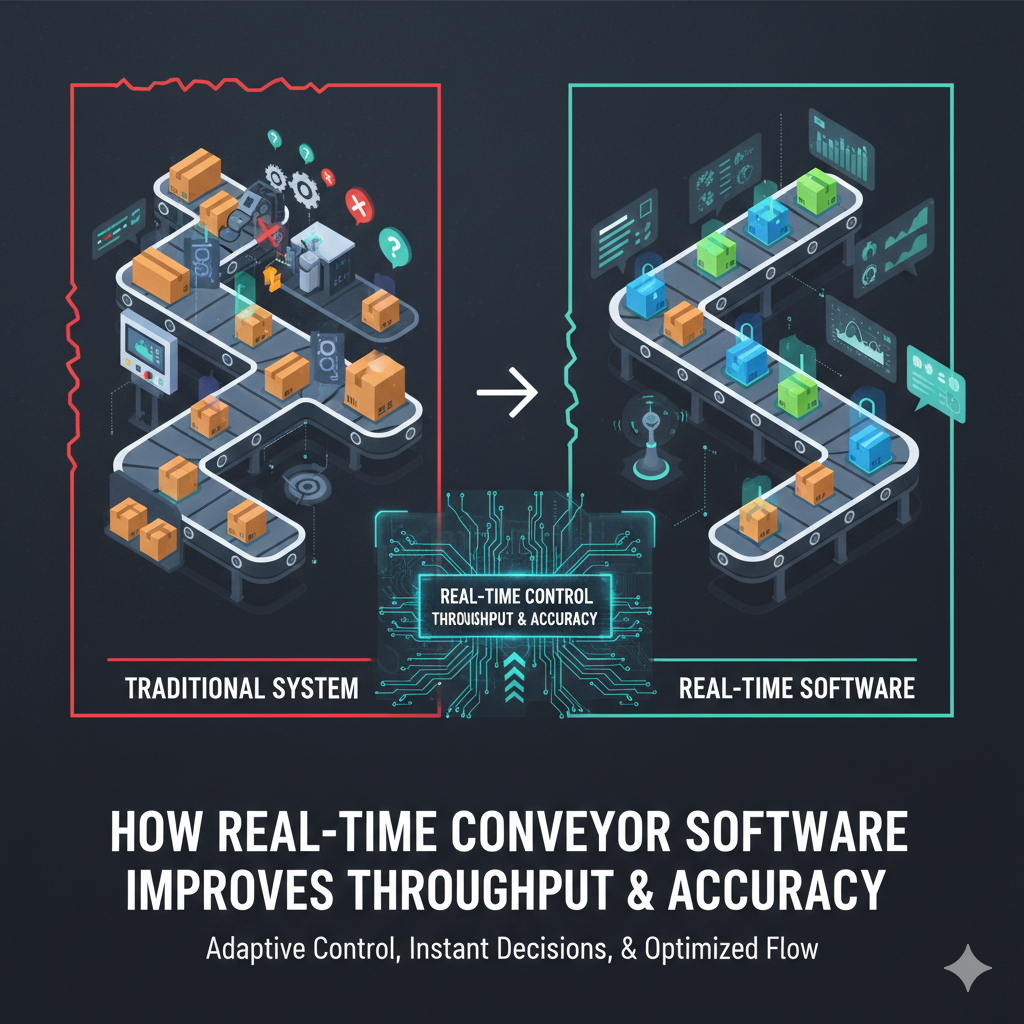
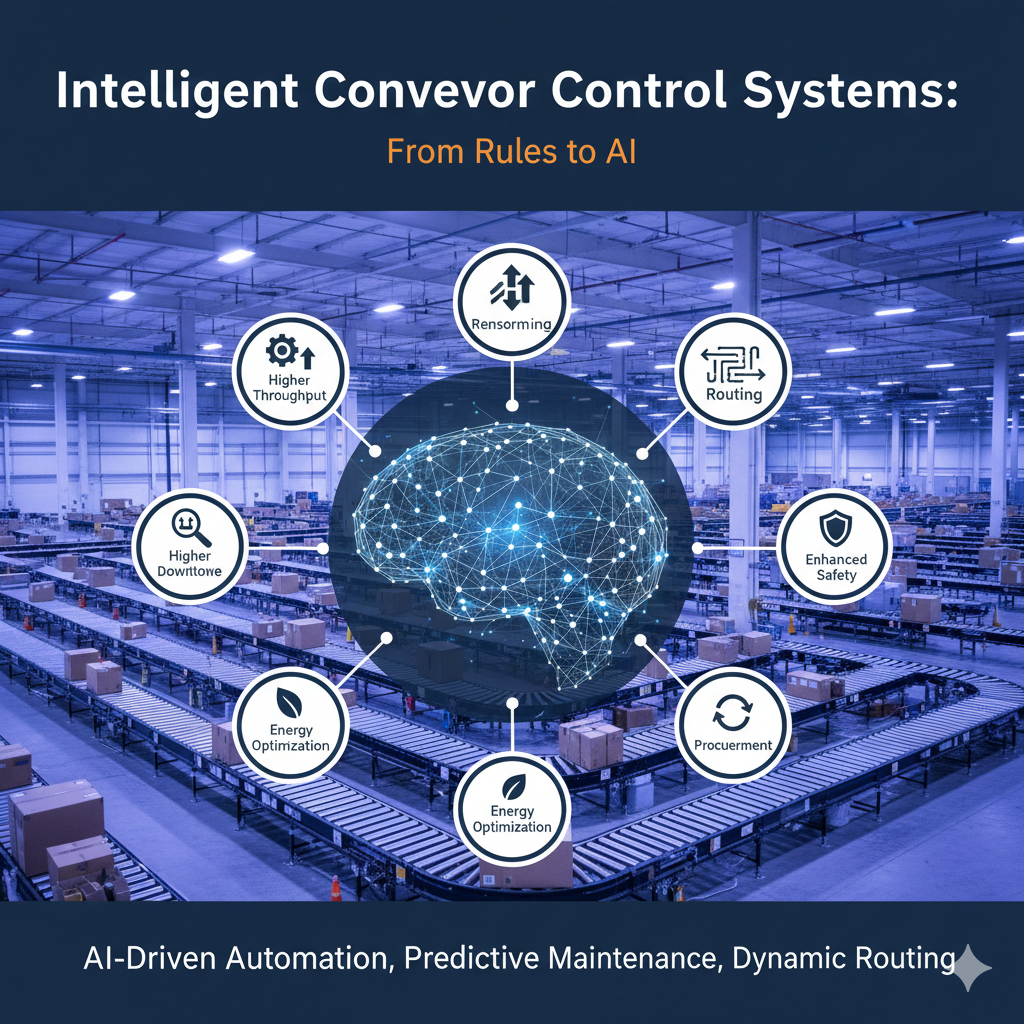
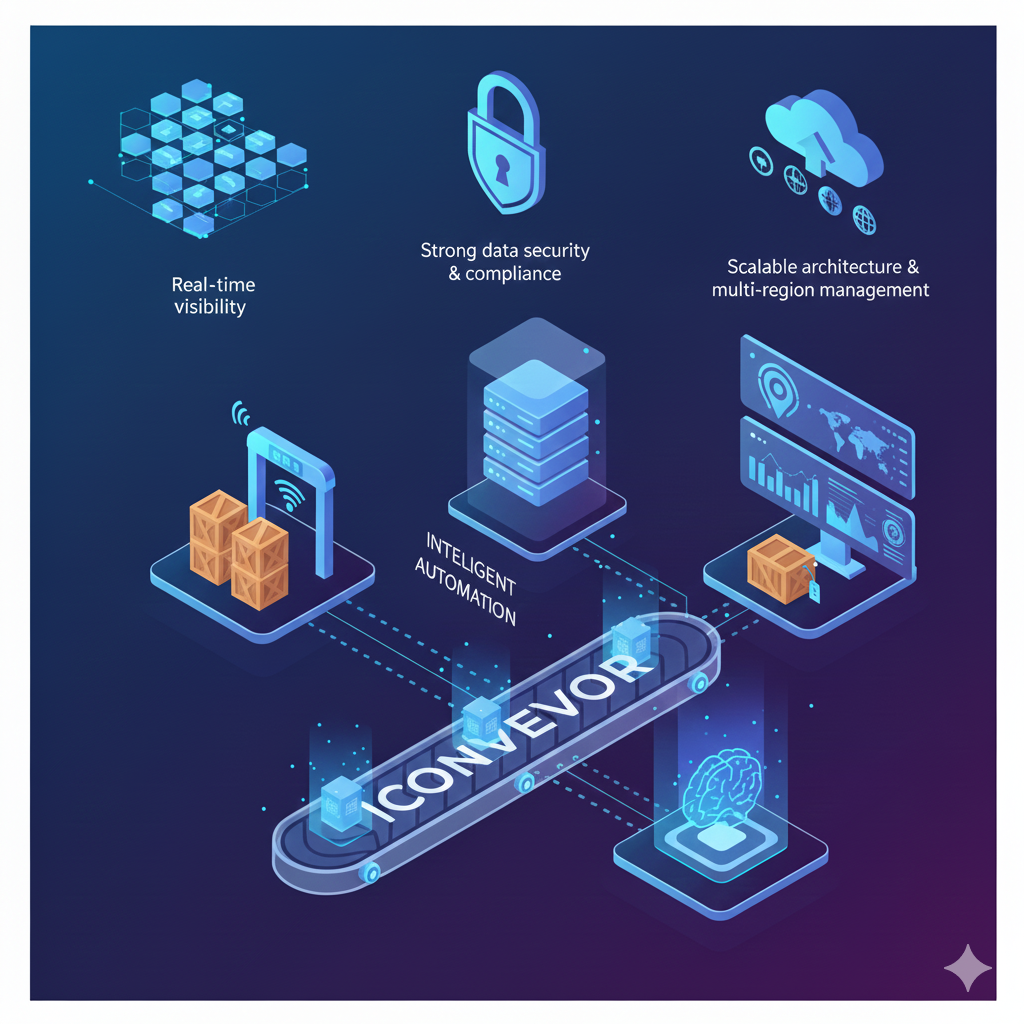
Modern conveyor systems have evolved from basic material handling equipment into intelligent operational infrastructure. With embedded sensors and connected monitoring technologies, they generate continuous streams of performance data. Real-time dashboards transform this data into clear operational visibility, empowering teams to increase throughput, minimize downtime, and enhance system reliability. The true value of these dashboards lies in focusing on the metrics that directly impact performance and business outcomes.
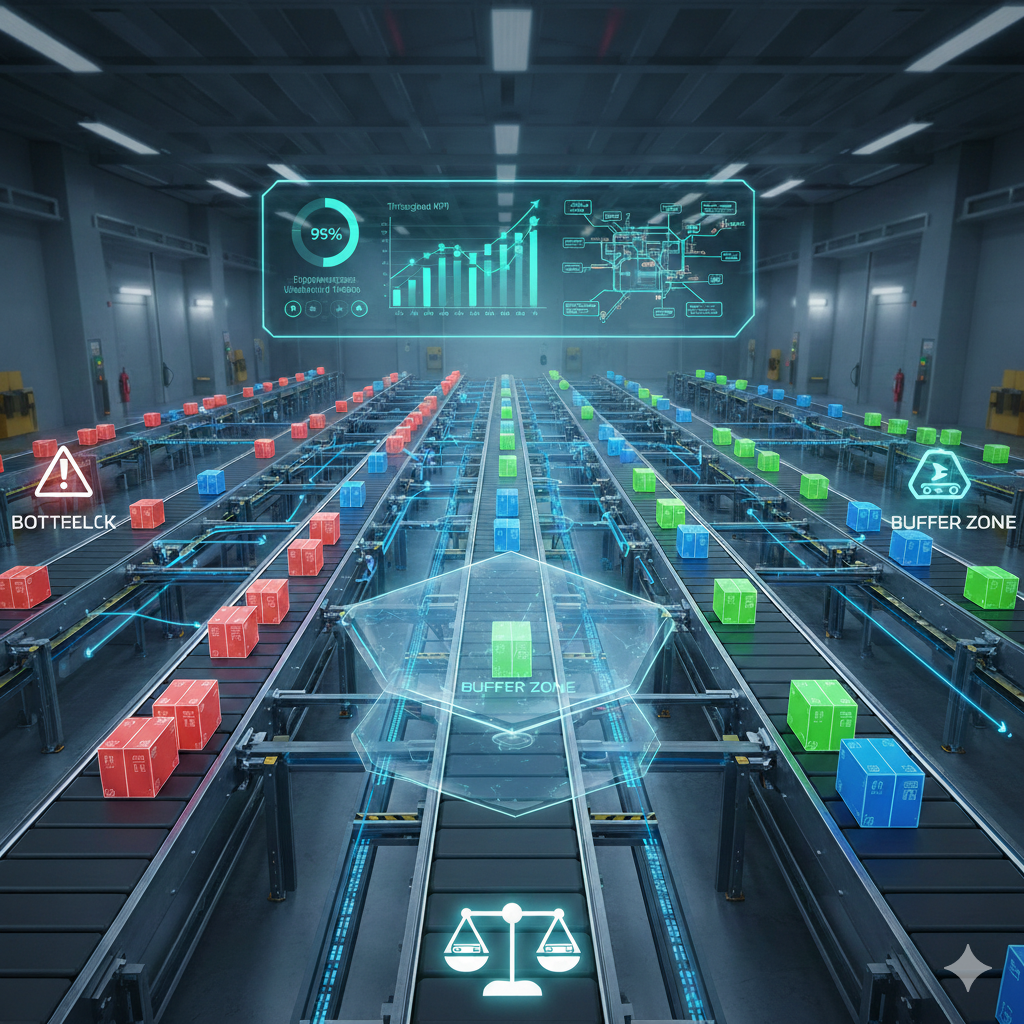
Step 1: Throughput and Material Flow 📦📈
• Monitors units processed per minute, hour, or production cycle ⏱️
• Represents total system productivity levels 📊
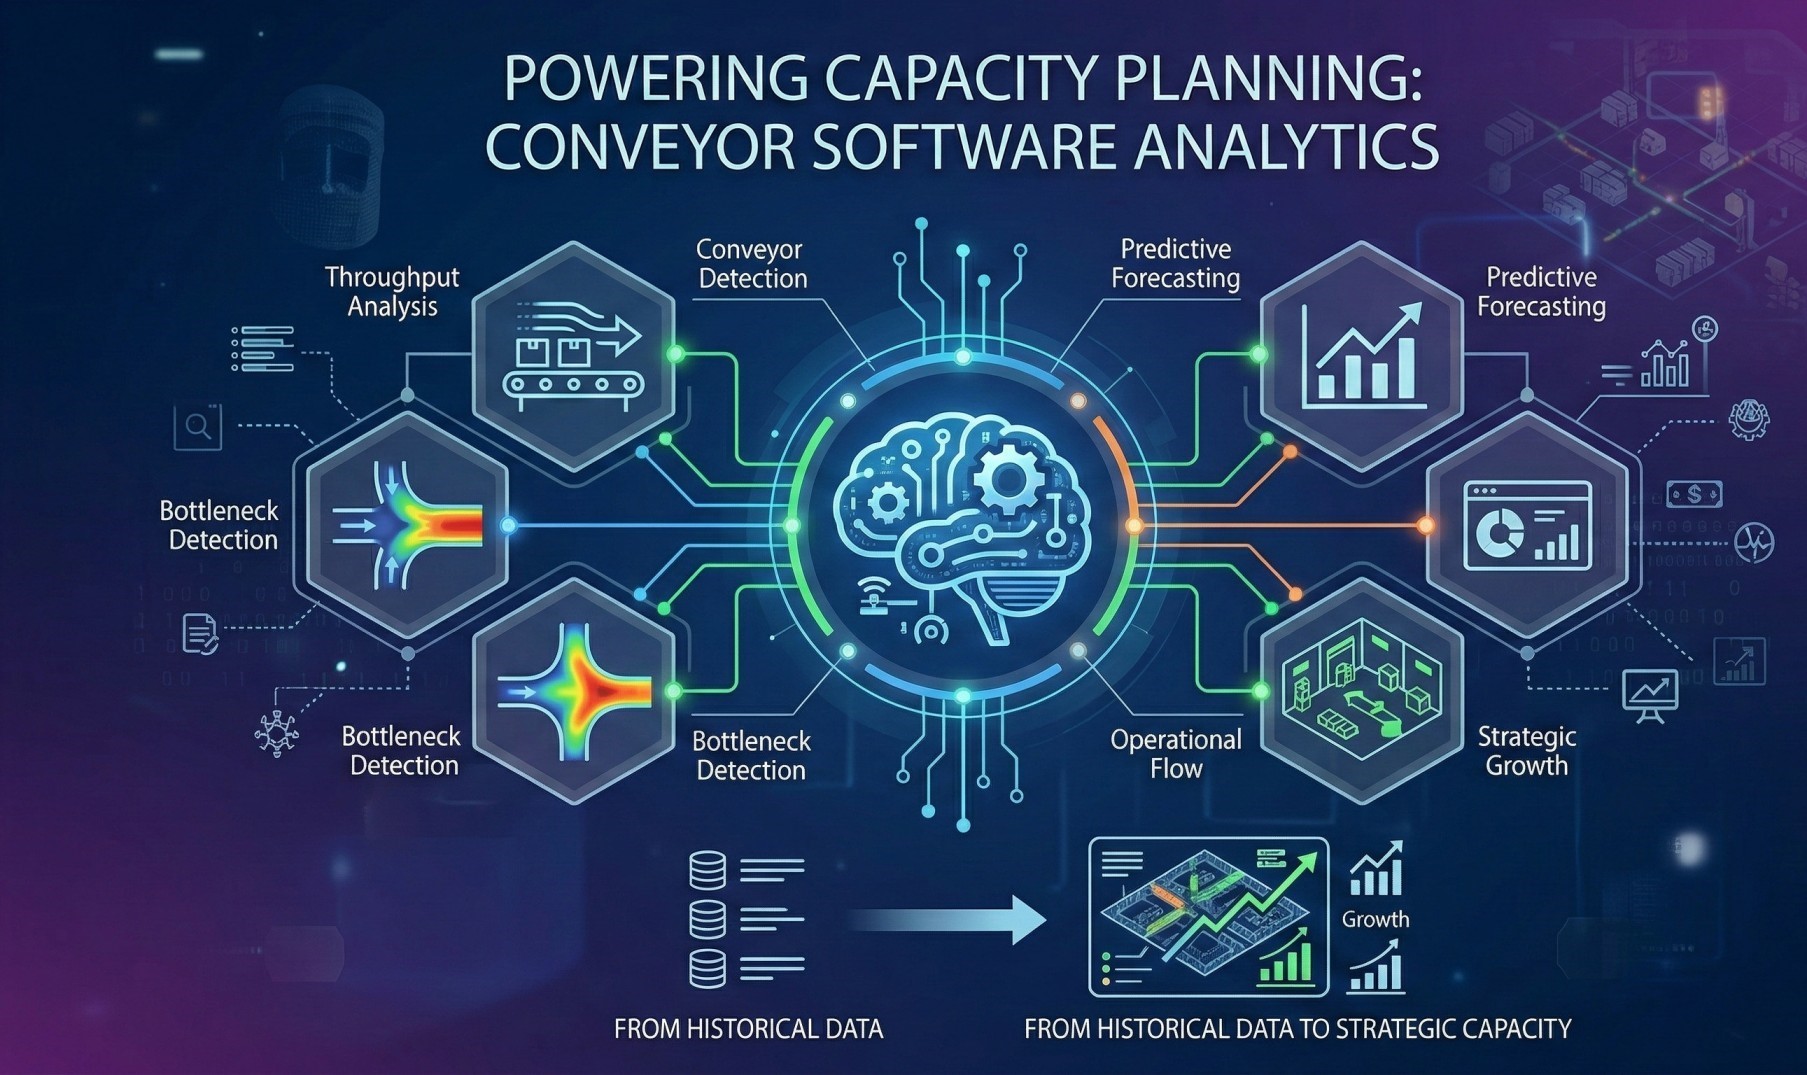
• Highlights bottlenecks and restricted flow areas 🚧
• Supports demand planning and capacity forecasting 🔮
• Confirms alignment between output and operational targets 🎯
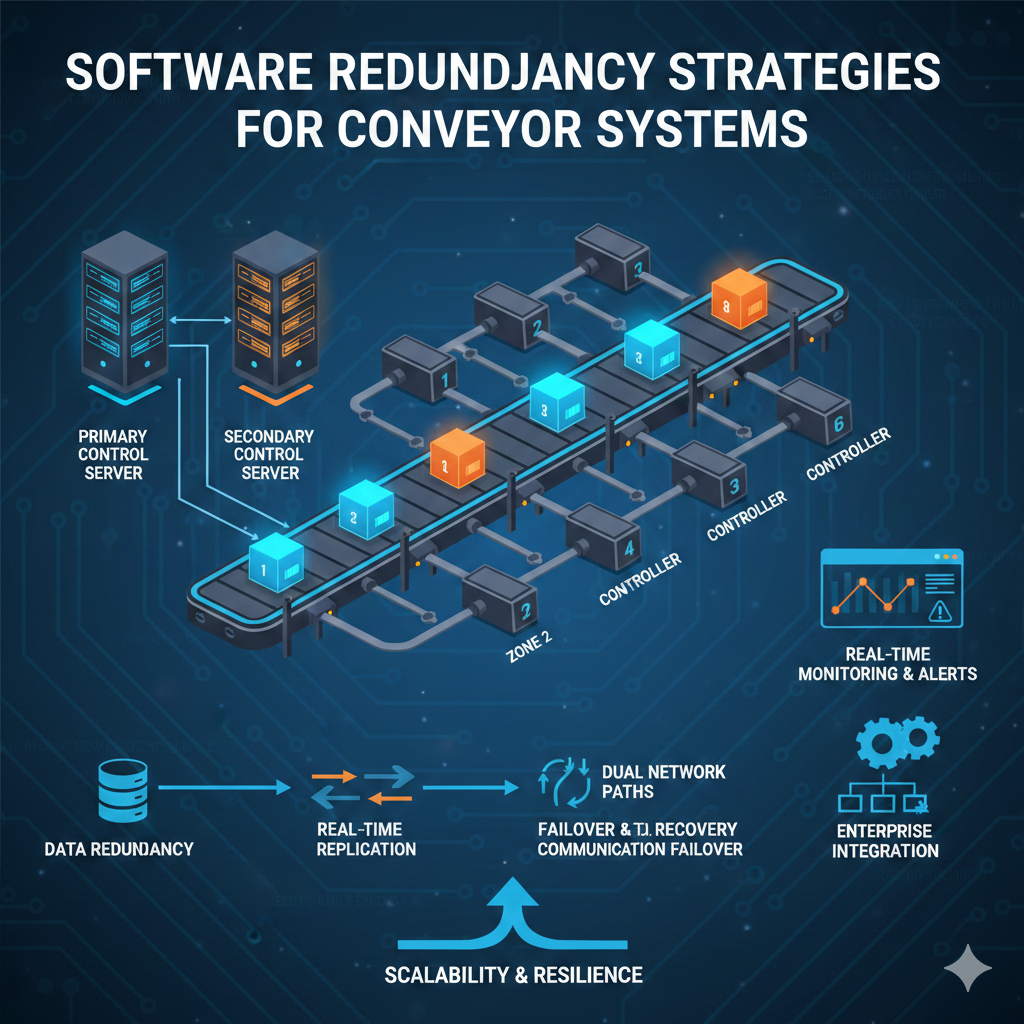
Step 2: Availability and Downtime Tracking ⏳🛑
• Assesses operational uptime across conveyor segments 🟢
• Tracks frequency and duration of stoppages 📉
• Differentiates planned maintenance from unexpected failures 🔧
• Enables structured preventive maintenance scheduling 📅
• Directly impacts overall production efficiency 📈
Step 3: Asset Utilization Efficiency ⚙️📊
• Measures how effectively conveyor capacity is being used 📦
• Detects uneven load distribution across zones 🔄
• Prevents excessive strain and premature component wear 🛠️
• Optimizes throughput without increasing infrastructure 🏗️
• Supports informed long-term investment planning 💼
Step 4: Component Condition Monitoring 🔍🛠️
• Tracks indicators such as motor heat, vibration, and energy consumption 🌡️
• Identifies early warning signs of mechanical stress ⚠️
• Enables predictive and condition-based maintenance 🔄
• Reduces risk of unexpected breakdowns 🚨
• Prolongs lifecycle of critical equipment components 🔩
Step 5: Real-Time Jam and Obstruction Alerts 🚦⚠️
• Instantly detects material buildup or flow interruptions 📦
• Prevents cascading slowdowns across connected lines 🔄
• Accelerates response and resolution time ⚡
• Improves operational safety standards 🦺
• Maintains stable and uninterrupted system flow 📈
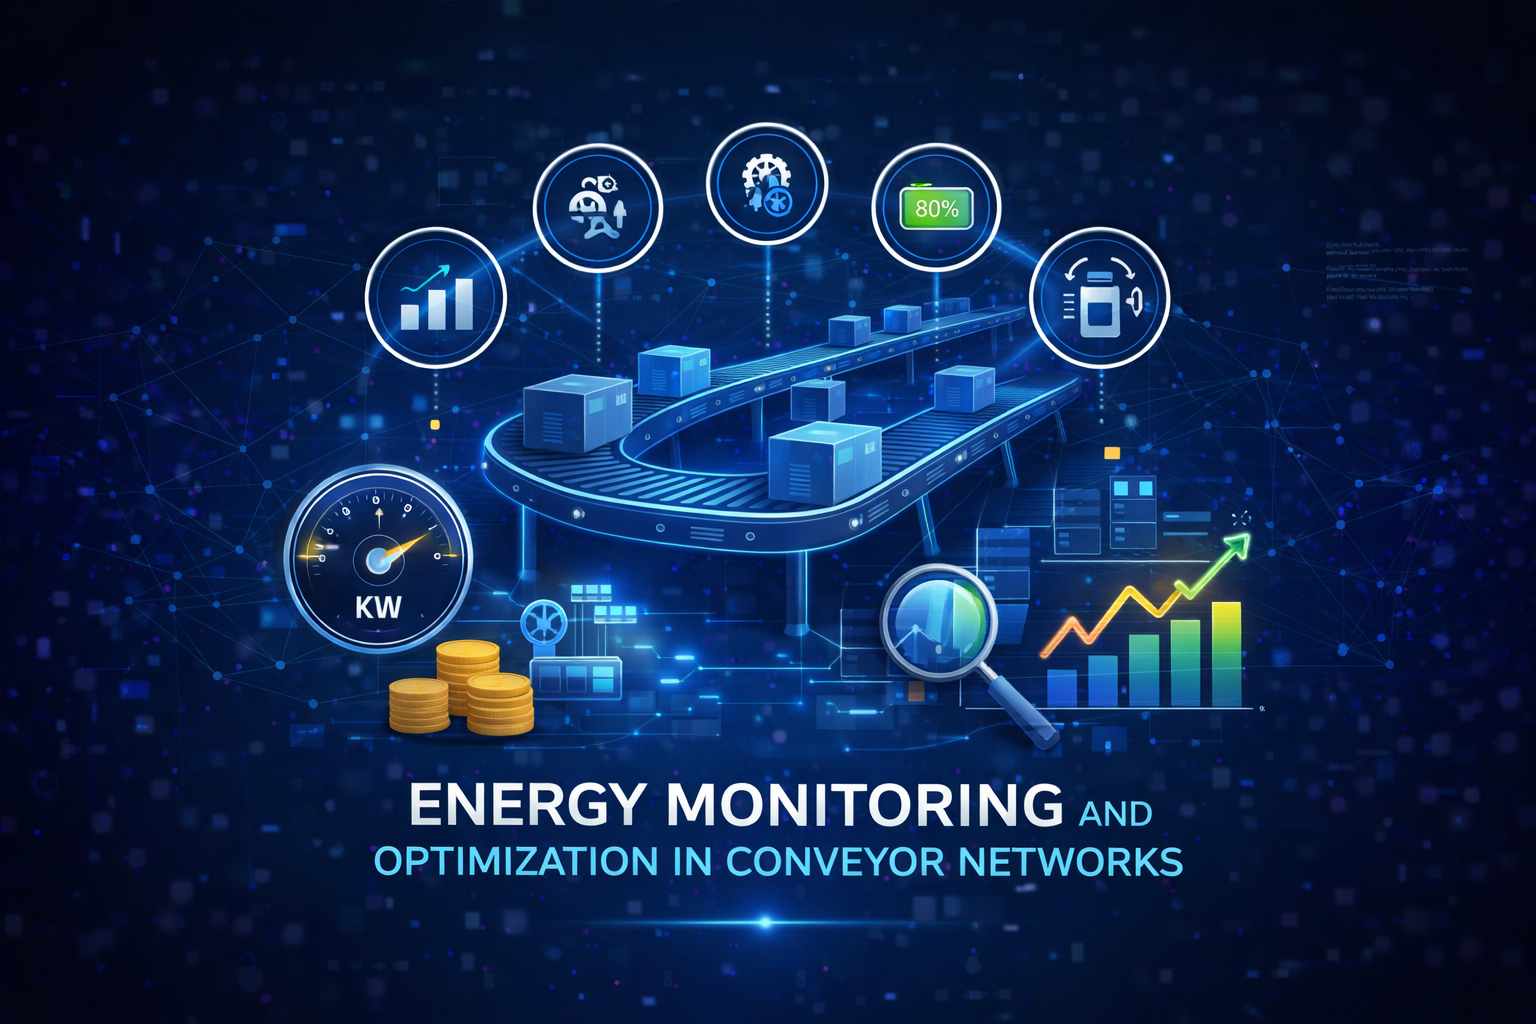
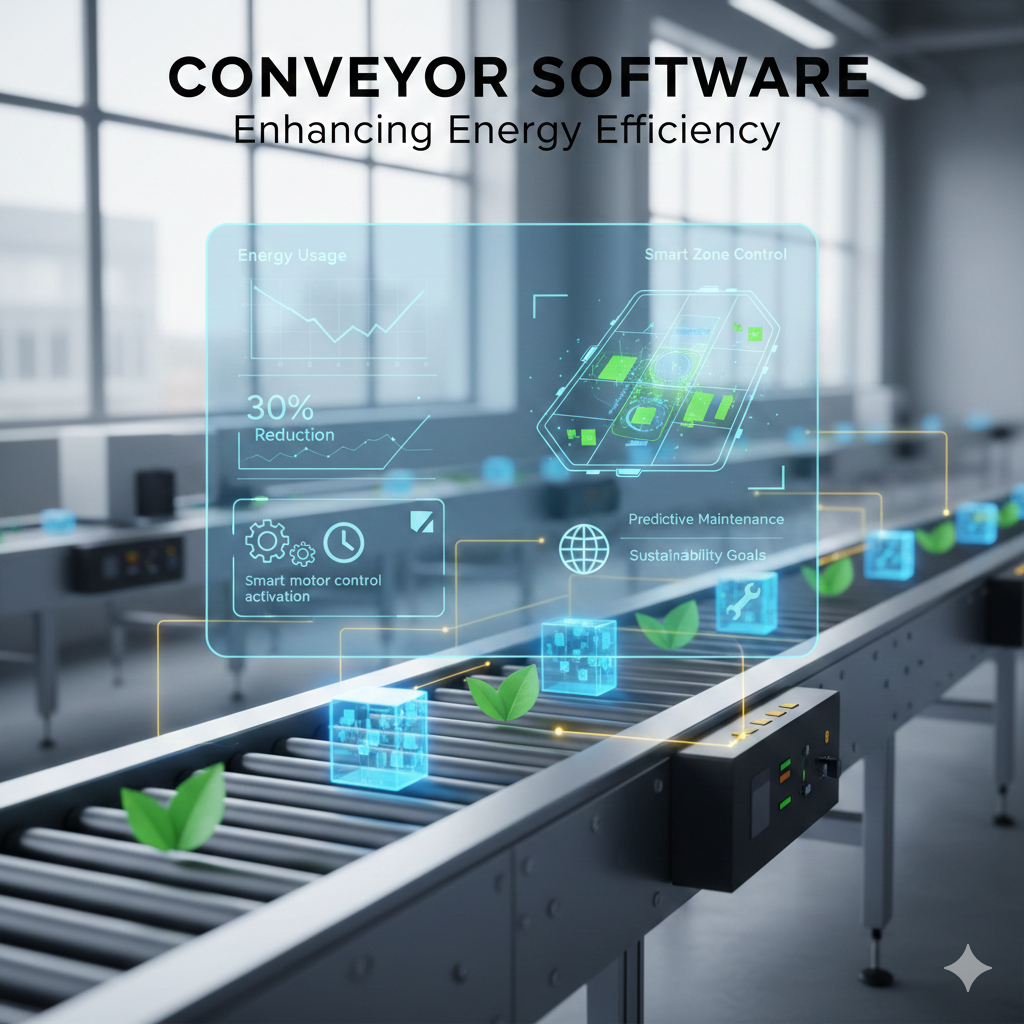
Step 6: Energy Performance Monitoring ⚡📉
• Tracks power consumption across conveyor sections 🔌
• Identifies inefficiencies in energy usage 📊
• Correlates energy demand with output levels 📈
• Supports cost-reduction initiatives 💰
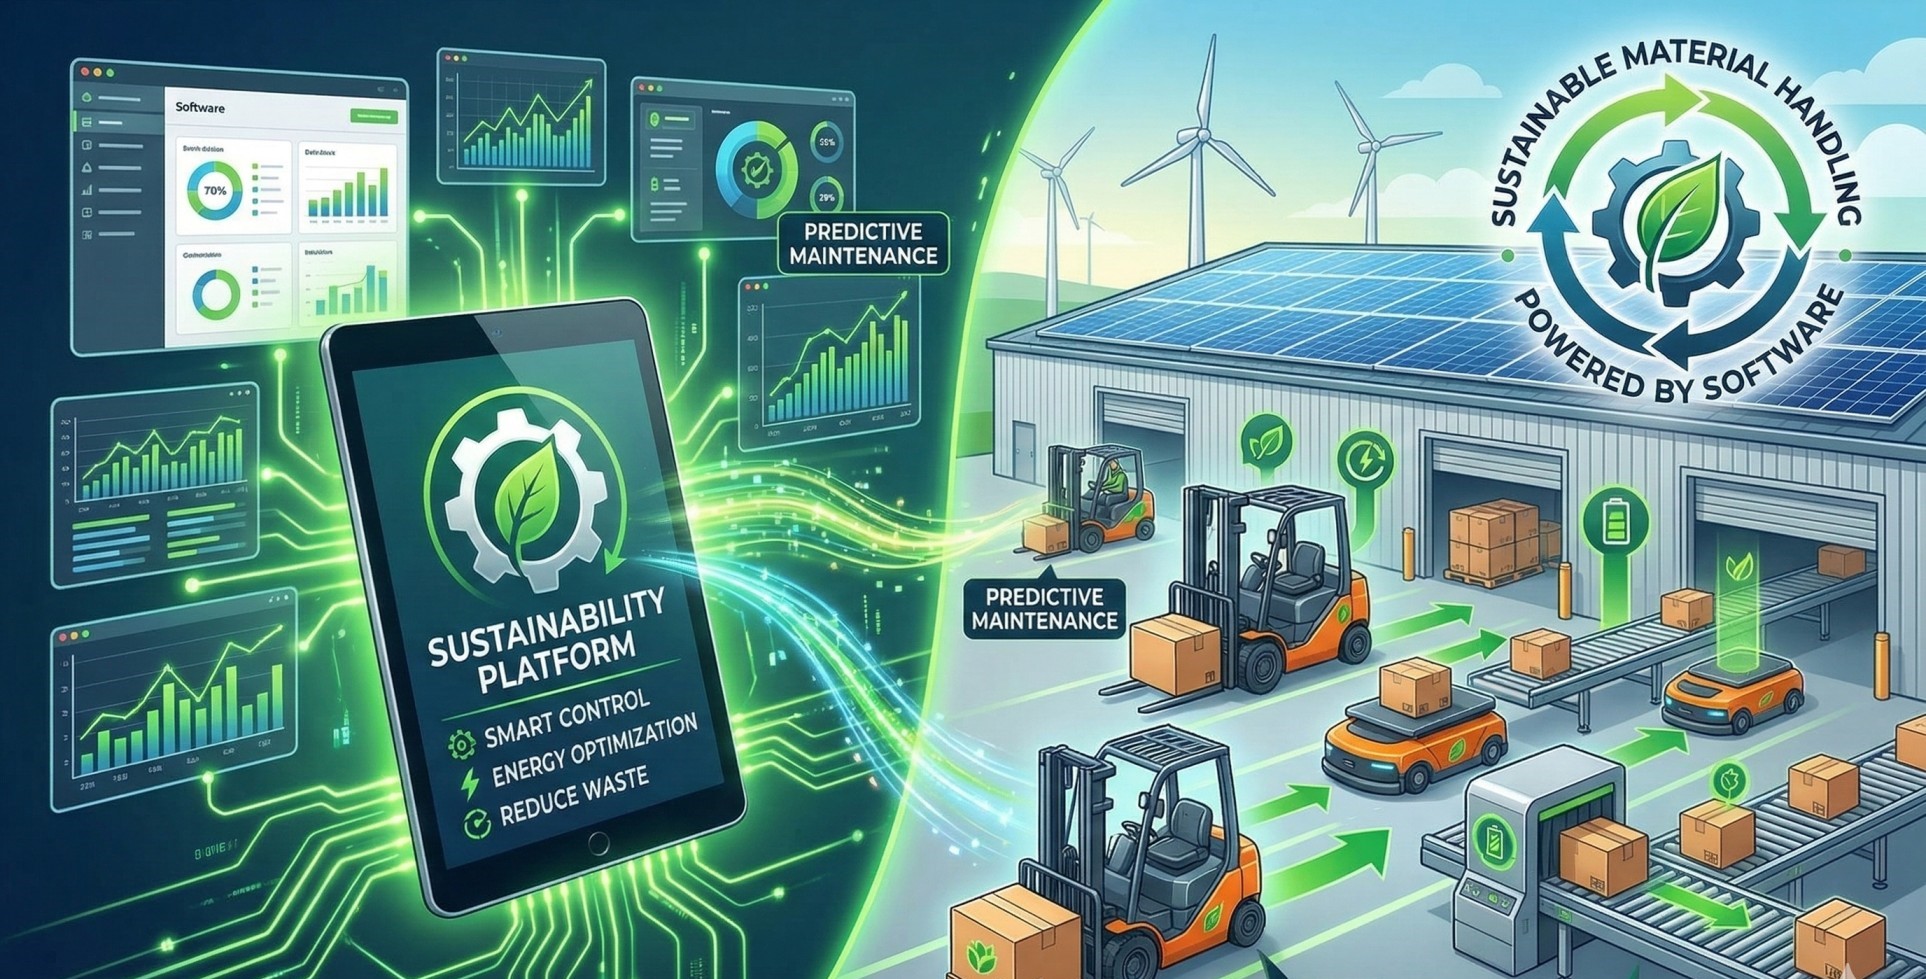
• Aligns with sustainability and environmental targets 🌱
Step 7: Routing and Tracking Accuracy 📍📦
• Validates correct product movement and sorting accuracy ✔️
• Minimizes fulfillment errors and shipment delays 🚚
• Improves traceability across operational stages 🔎
• Strengthens coordination within the supply chain 🔗
• Enhances delivery performance benchmarks 📊
Step 8: Strategic Performance Indicators 📊🏆
• Overall equipment effectiveness (OEE) 📈
• Cost per unit transported 💲
• Throughput performance against defined targets 🎯
• Financial consequences of downtime 💼
Conclusion
High-impact real-time conveyor dashboards prioritize metrics that directly influence both operational efficiency and business performance. By concentrating on material flow, uptime, equipment health, energy usage, and executive-level indicators, organizations avoid data overload while gaining meaningful insight. When aligned with strategic objectives, these dashboards become critical tools for sustaining productivity, reducing operational risk, and enabling long-term performance optimization.
See more blogs
You can all the articles below